Powerpoint
Per Group:
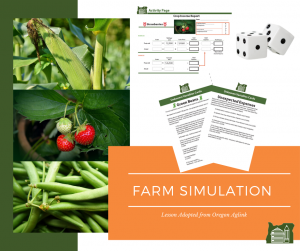
•1 Farm Map
•1 Farming Game Crop Projections
• 5 Crop Income Report
• 1 Farm Income Summary Report
• 1 set of Unknown Variables Cards
• 1 Dice
• Crayons or colored pencils
• Pre-filled Farm Maps (Optional)
Categories: Easy Do-at-Home Activity , Math , Introduction to Agriculture , Spanish , Agriculture , Plants , Science
This activity will introduce students to farm economics and the variable forces affecting crop production and sales. Students will learn that farming is a business and the importance of anticipating and managing risks that affect profit. Lesson adopted from Oregon Aglink.
Directions:
Using the Farm Simulation Powerpoint slides, work through each slide completing the tasks that are described in the content side of the table below.
Management Team
Many farming operations around the state of Oregon are farms owned and operated by families. Today, you are going to take on the role of a farm management team. Your farm management team will be responsible for a 1,000 acre farm. Once you have been assigned a group, sit together and decide on a farm name for your group.
After one minute, go around and ask each group to share. Tell students that the farm name for their group will be the name they write on all your paperwork.
Transition: Before we get started making important management decisions regarding your farm, we are going to review some vocabulary.
Measurement Vocabulary
These terms on the slide are all very important to farmers with regards to measurement.
Ask: Can anyone tell me how big an acre is?
An acre is a little bigger than the size of a football field.
Ask: By show of hands, has anyone heard of the term bushel?
A bushel is a measurement used for wheat and other dry goods, it equals about 8 dry gallons or just over 9 liquid gallons.
Ask: By show of hands, have you ever complained about having “a ton” of homework?
The term ton is a measurement equal to 2,000 pounds.
Finally, the word yield is what farmers refer to when they are talking about the quantity, or how much, of a product is produced. For example, “our broccoli yields were about 4.5 tons this year.”
Explain that it means 4.5 tons of broccoli were harvested per acre.
Profit per Acre
1. Distribute one Farming Game Crop Projections worksheet to each group.
2. Explain to students that these five crops will be planted on each of their farms. Based on the information provided, students will determine how many acres to plant of each crop. If you have 40 minutes or less to complete this activity, you will assign the amounts of each crop that groups plant using the Pre-filled Farm Map worksheets.
3. Choose one crop to explain as an example moving across the projection chart.
For example, the yield for 1 acre of wheat is 125 bushels, (What does yield mean?)
For every bushel, ton or pound of a crop the farmer should be able to sell it for the amount listed in the sales price category.
To determine the revenue (the amount of money received from goods sold), you will multiply the yield by the sales price. The farms expenses for growing and harvesting each crop are listed in the chart, to calculate the profit of each crop you will subtract the expense from the revenue.
4. Have students work with their group members to talk about each crop and complete the revenue and profit portions of the chart on their worksheet or fill in their chart using the answers from this slide.
Allocating Acres on Farm Map
1. Explain the thought process behind farmers planting.
For example: Every year, farmers plan for the next planting season taking into account cover crops, rotating and neighboring crops, and each of the items listed on the Farming Game Crop Projections worksheet.
2. Instruct students to work with their groups to determine the amount of acres to plant of each crop. Remind them of the following before they begin:
You must grow all 5 crops
You must stay within the minimum and maximum acre requirements
All 5 crops acreage must add up to 1,000 acres
Each square on your graph paper equals 5 acres.
2. Distribute the Farm Map worksheet to each group.
3. Remind students that the goal of their farm is to make the most money while considering the risks that come with each crop. Be careful of the amount of each crop you decide to plant because some markets are highly unpredictable.
For example, strawberries are a very volatile crop, meaning if it is a good year, you can make a lot of money, but if it’s bad, it will be really bad and could sink the farm. More stable crops are the wheat and rye grass.
4. Give groups five minutes to decide the amount of acres to plant of each crop. Once students have determined the acreage of each crop, they should list them in the Map legend area on their Farm Map worksheet.
5. Review each group’s planting decisions once they have been finalized, then provide them with crayons. As a group, you will work to develop a map to plot your crops on your land.
6. Instruct students to color the grid on their Farm Map worksheet based on the acreage they decided to plant of each crop.
Income Report
1. Talk to students about the importance of budgeting.
For example, as business owners, it’s important to budget tracking both your costs and income. We categorized these in two categories projected and actual.
2. Read students the definitions of projected and actual.
Ask: What are some costs that farmers would need to account for on a farm? (inputs, labor, etc.)
Calculating Projections
1. Distribute the 5 Crop Income Reports for each crop to each group.
2. Instruct students to pass one to each group member, each group member will be in charge of a different crop for their group.
3. List your farm name in the space provided at the top of the worksheet.
4. In the projected acres box for both revenue and expenses, record the number of acres your group decided to plant of that crop. Multiply the numbers across the row to determine the Projected Total Revenue in the top section and the Projected Expenses in the lower section.
5. In the revue section, record your Projected Total Expenses from below to determine the Projected profit/loss.
6. On your Income Summary Report, compile each crops Projected Profit/Loss.
7. Calculate the Projected Initial Profit/loss by adding all of the above projected profits together.
Income Summary Report
1. On your Income Summary Report, compile each crops Projected Profit/Loss.
2. Calculate the Projected Initial Profit/loss by adding all of the above projected profits together.
Why do a Projection?
1. Describe the importance behind calculating projections using the points provided on the slide.
Roll the Dice!
1. Distribute a dice to each group.
2. Have each group member roll the dice and record it on their Crop Income Report under the space provided, Crop Dice Roll # ________
How did your crop fare?
1. Explain that there are many variables that affect the profitability of a crop.
2. Distribute a set of Unknown Variables Cards to each group.
3. Explain that each group member should grab the card associated with the crop that they have been calculating the income report for.
4. Using the number that they just rolled on the dice, they will read that number scenario on their unknown variable card.
5. Record the consequence of that unknown variable in the space labeled consequence:___________. For example, yield decrease by 15%.
6. Have students work to fill in their actuals on the Crop Income Report using the changes in their farm from their unknown variables.
7. Once students have recorded their acres, yield per acre and sales price, have them multiply the three numbers together to determine the Actual Total Revenue.
8. Then, have students calculate the Actual Total Expenses by multiplying acres by cost per acre. Record it in the box labeled Actual Total Expense.
9. Students will use that same number to record it in the Actual Total Expenses box to be subtracted by the Actual Total Revenue.
10. Subtract the Actual Total Expense by the Actual Total Revenue to determine the Actual Profit/Loss.
Income Summary Report Calculations
1. Compile each crops Actual Profit/Loss on the Income Summary Sheet.
Note: Remind students that a positive number is a profit and a negative number is a loss.
Expect the Unexpected!
1. Explain to students some of the unexpected incidences that could occur on a farm that would result in unexpected expenses.
Note: the pictures displayed on this slide are all photos from farmers in Oregon and provide real-world examples of those unexpected expenses.
Unexpected Events Report
1. Have one person from each group roll their dice, all members in their group will record the same number on each of their Crop Income Reports under Group Dice #__________ .
2. Read through the unexpected event scenario on the Unwanted Variables Cards to see the consequence associated with the dice roll. Record the consequence in the space provided on the Crop Income Report under Unexpected event:__________________.
Income Report Calculations
1. Add or subtract the unexpected event’s consequence to the Income Summary Report under the row ”Unexpected Revenue or Expense”
2. Calculate the Final Profit/Loss for your farm and record it in the space provided.
Final Thoughts
1. Review the questions on the final slide with students.
2. Make sure they have the chance to ask questions!